
I rebuilt 2,681 smart-money portfolios
Most lose to the index (but thats not the end of story).

45 Days Late #1. This series is a research journey through 13F filings, the quarterly documents where big investors show their hands: what the data really says, where the edge is and is not, and how I use it in my own investing. Each post answers one question and opens the next. We start with the biggest one.
Every “Warren Buffett just bought X” headline traces back to the same public document: a 13F, filed quarterly with the SEC by anyone managing over $100 million in US stocks.
The dream 13F filings sell is irresistible. Somewhere in those filings is a genius, and if you find the genius, you can just... do what they do. Free ride, minus 45 days.
I run a tool that reads these filings all day, so I had the machinery on hand to ask the question the dream depends on: if you had followed any one of these funds, would you actually make any money?
Lets just check ALL OF THEM.
How I measured it
Some mechanics first.
A 13F discloses a manager’s US stock positions at each quarter end, with a 45-day filing deadline.
The raw filing record is a zoo: banks, index shops, quant farms holding three thousand tickers, pension overlays. No “smart money” headline was ever written about those, so the first job was pruning the field down to the funds the dream is actually about.
I started with every institution that filed 13Fs for at least five consecutive years between 2013 and 2025, dead or alive: 5,830 filers. Keeping the dead ones matters; a study of survivors only flatters the field.
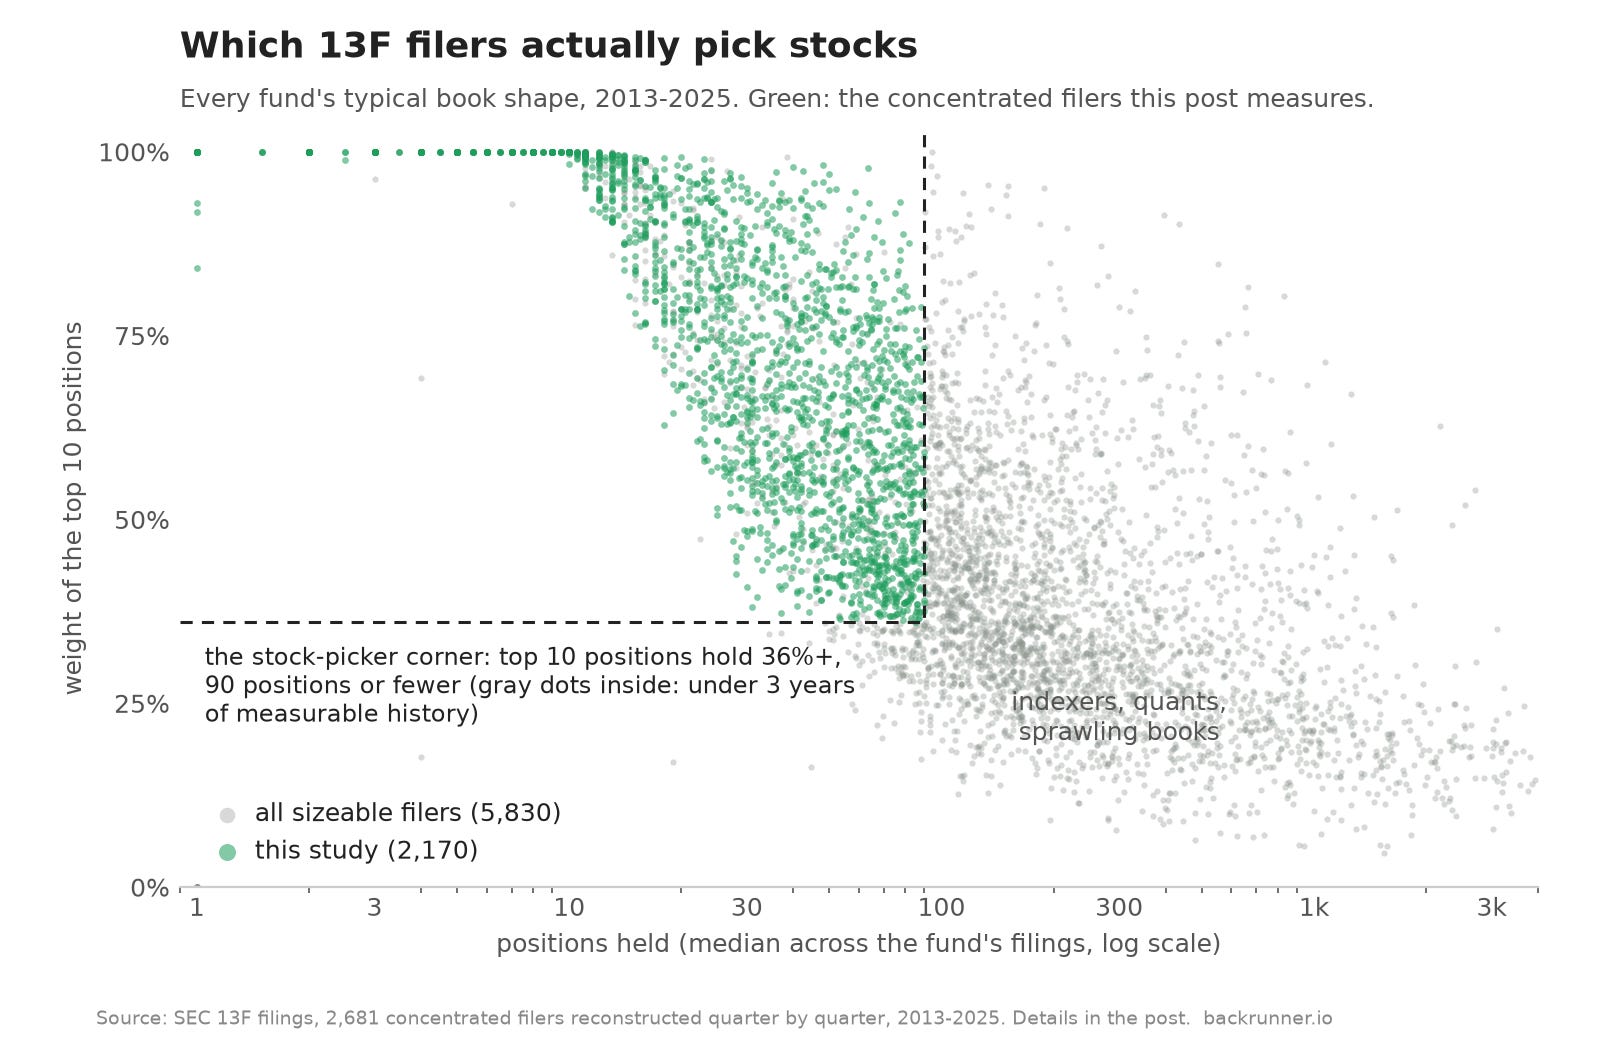
Then a blind shape rule, no names, no performance peeking: a fund stays if its typical filing puts at least 36% of the book in its top 10 positions and holds 90 positions or fewer. A book that looks like conviction, not an closet indexer. Although I must admit - my description is pushing it a bit, since on top 10 weight S&P500 today is around 38%.
That leaves 2,681 funds filing like actual stock pickers, and they look the part: the median book runs 33 positions with three quarters of its value in the top 10. Mostly boutiques too, median disclosed book $266M, with Berkshire sitting alone at the far end at $211B.
Each dot is one filer’s typical book shape. The gray cloud is diversification; the green corner is conviction, and it is what this series measures.
For each of those funds, each quarter, I rebuilt the portfolio from the filing, weighted by position size, and measured what that exact book returned over the following three months at dividend-adjusted prices. Chain the quarters and you get each fund’s track record as its own filings tell it. A quarter counts only when at least 85% of the book’s value has usable prices (early years are thinner), and a fund enters the results only with at least three years of measurable history: 2,170 funds clear that bar. Where an independent reconstruction exists to check against, 54 funds, the two agree almost perfectly.
One honest limitation, and it matters: a 13F shows no shorts, no foreign listings, no cash, nothing bought and sold inside a quarter. Everything below is a statement about the disclosed US long book. That is exactly the part of the portfolio the copy-trade dream is built on, which is why it is the right thing to measure.
Finding one: the typical filer loses to the index
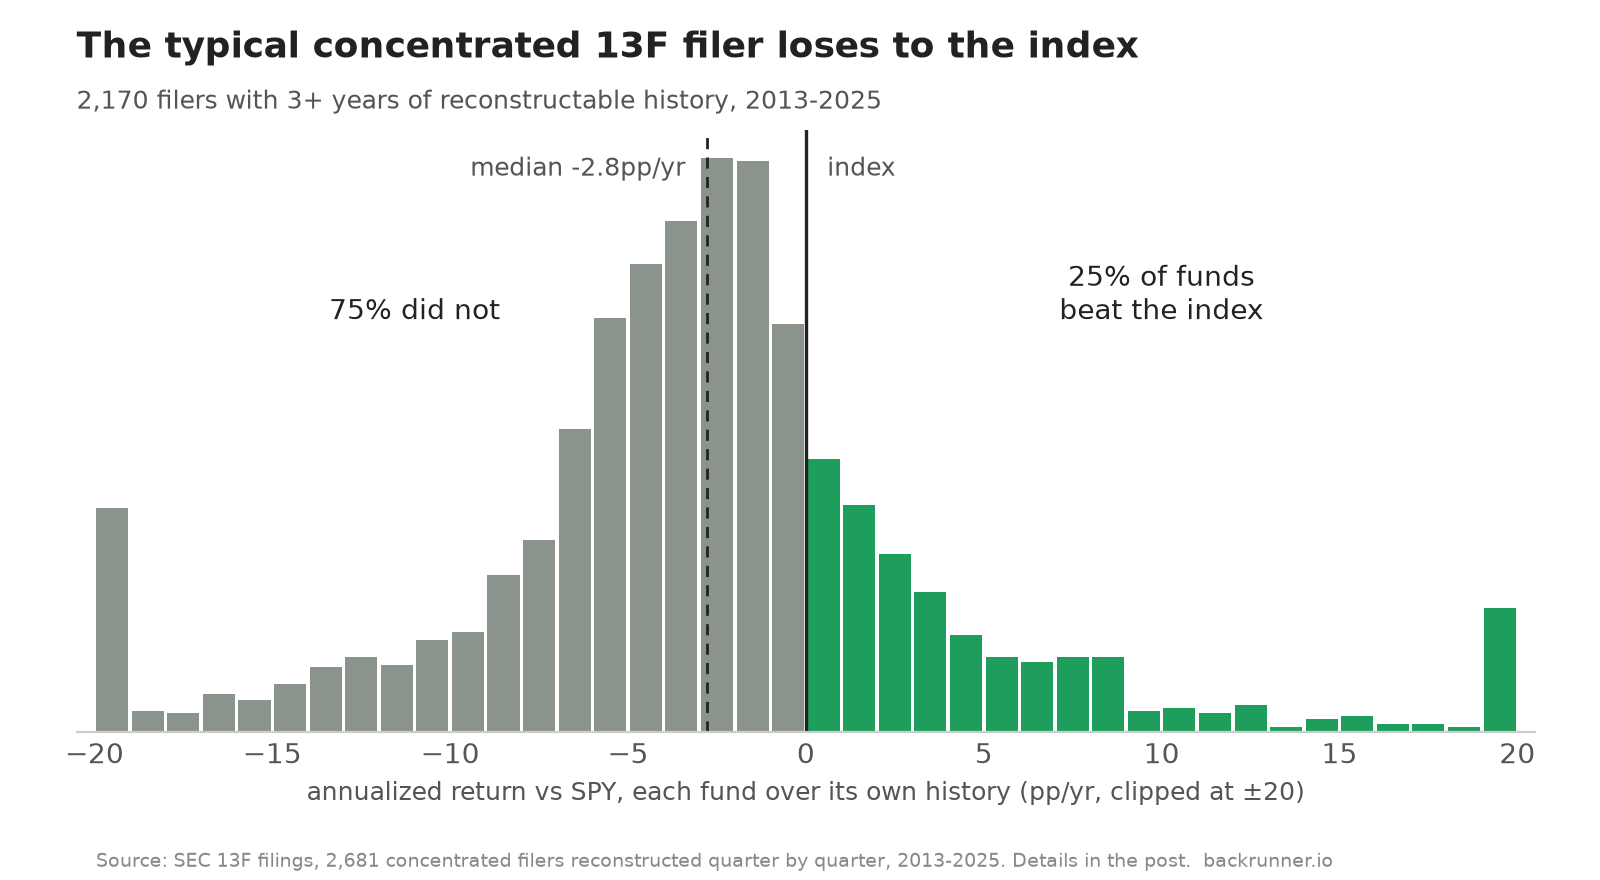
Of those 2,170 funds, 25% beat the S&P 500 over their own window. The median fund trails it by 2.8 percentage points a year. The spread is wide in both directions, but the middle of professional stock picking, as disclosed in its own filings, underperforms a $10 index fund.
The field, one dot per fund compressed into a histogram. The median professional book trails SPY by 2.8pp a year.
If that number feels familiar, it should: it is the SPIVA result. As of
mid-2025, 87% of active large-cap funds trailed the S&P 500 over five years and 86% over ten. Mine is a different animal measured from a different document trail, concentrated 13F books instead of mutual fund returns, and it lands in the same place. Concentration and a hedge-fund letterhead do not repeal the result.
Finding two: the winning cohort doesn’t stay winning
Fine, you say, I will not follow the average fund. I will follow the winners!
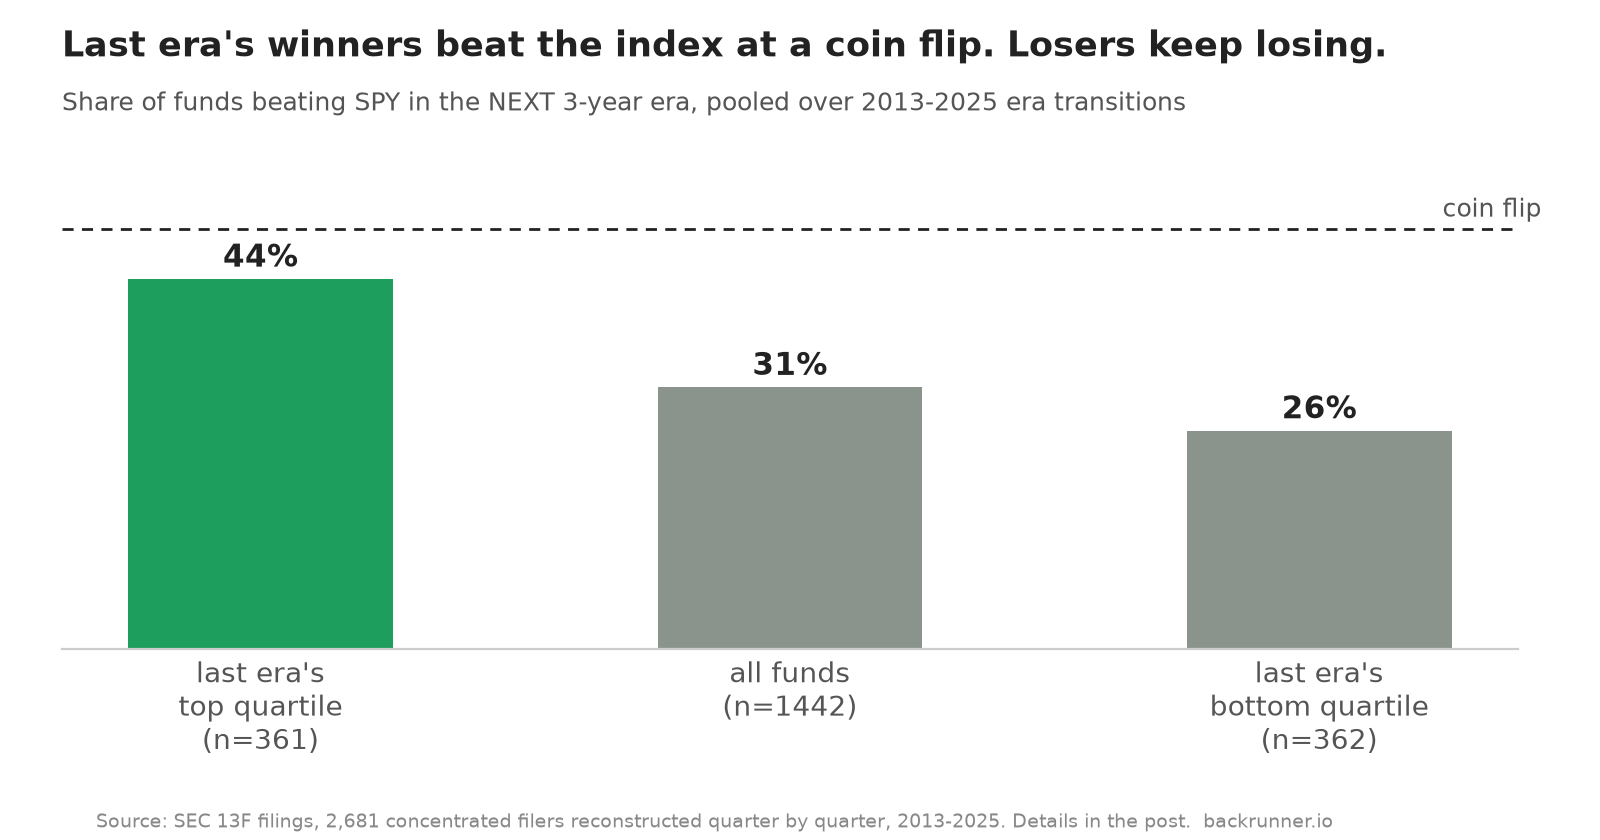
So I split 2013-2025 into four 3-year eras and, instead of gawking at each era’s freak champion, followed the whole winning cohort: every fund that finished an era in the top quarter of the field. Pooled across the decade, that is 361 fund-transitions, a real sample, not an anecdote.
Here is what being a certified recent winner bought them. In the following era they beat the index 44% of the time, with a median excess of minus 0.7 points a year. A coin flip that pays slightly worse than a coin. And the coin is getting worse: the first winning cohort (2013-2016) still beat the index 62% of the time in the next era; the most recent one managed 40%.
Yesterday’s winners converge to ordinary. Yesterday’s losers stay losers.
Two honest nuances. Winners do keep their relative rank a bit more often than chance (37% repeat top-quartile against the 25% a shuffle would give), so screening on past performance is not completely information-free.
It just is not the information you wanted: staying in the top quartile of a field that mostly trails the index is a prize for the wrong contest. And the bottom of the table is far stickier than the top: last era’s losing cohort lands below the index again two to six times out of seven, era after era.
(The single best fund of each era, if you are curious, was usually not even a decision-making fund: three of the last four era champions were effectively one stock wearing a filing. Leaderboards select for accidents, which is its own reason to never read one.)
Finding three: losing persists, winning mostly doesn’t
The sharpest way I found to see it: take the 177 funds with full 12-year history, count how many of the four eras each one beat the index, and compare that to what blind luck would produce (coin flips at each era’s actual beat rate).
Both tails are fatter than chance, but not symmetrically. The bottom one is where the persistence lives.
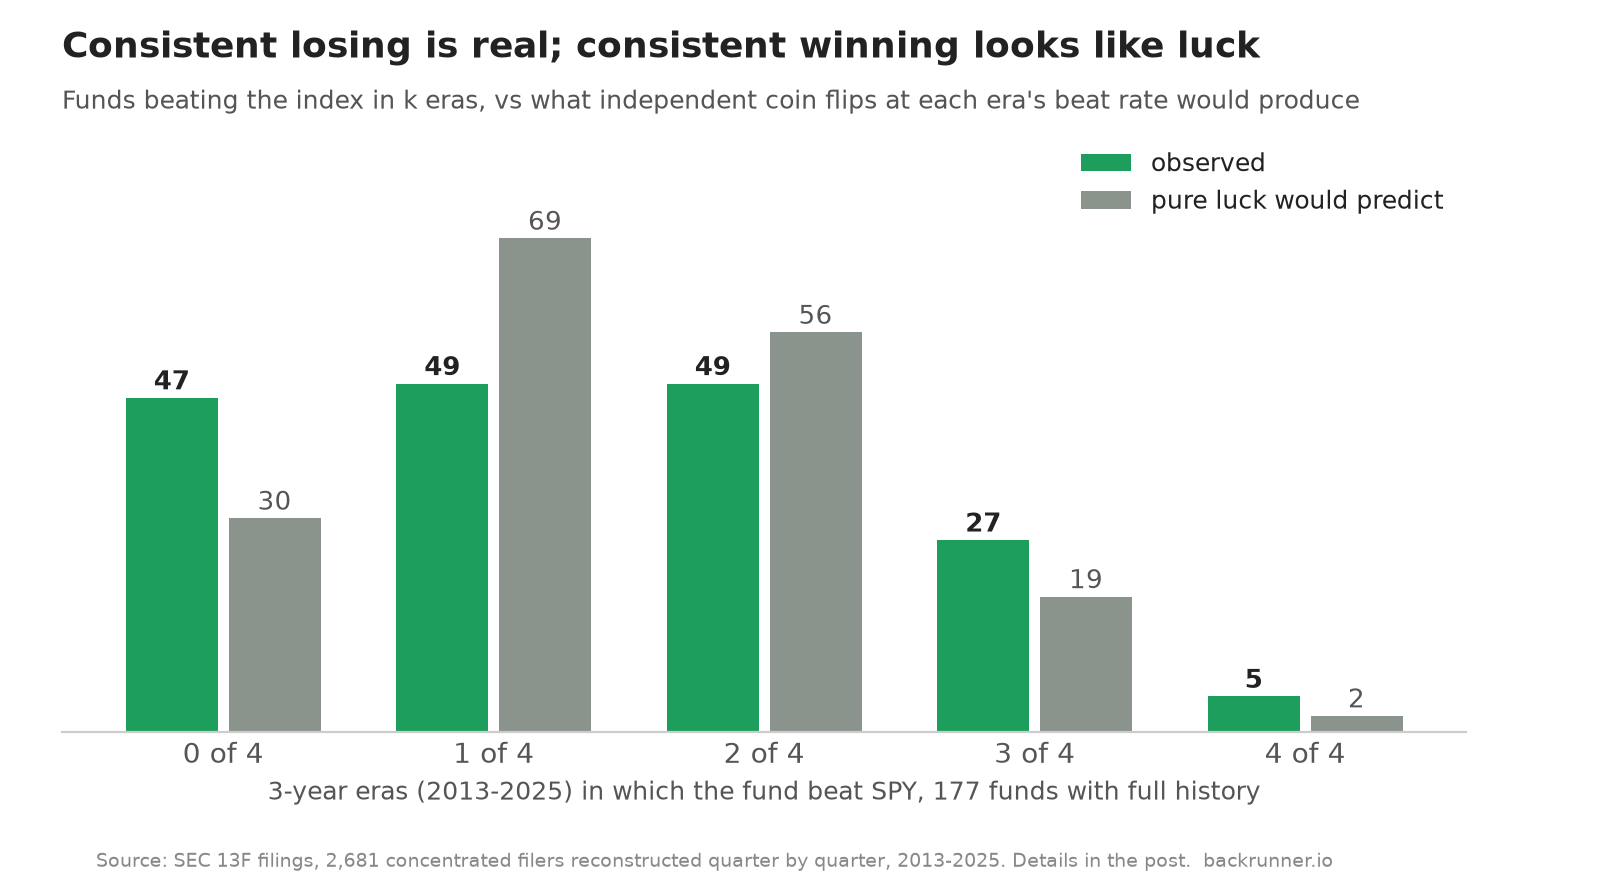
Five funds beat the index in all four eras; luck alone predicts about two, and the gap is within noise. I checked what those five books were before anyone calls them proof of skill: one is an endowment holding a single inherited stock, three rode the mega-cap tech decade nearly wire to wire, and exactly one is a conventional diversified manager. The consistency club is mostly luck plus style exposure, not wizardry.
The other tail is different. Forty-seven funds, one in four, never beat the index in any era, where chance predicts thirty. That gap is not noise. Persistent losing is the one durable, repeatable pattern in this data. Put dryly: the market does not reliably let anyone win four eras straight, but it absolutely lets some funds lose four eras straight, and they do.
And before you ask: adding the follower’s lag, buying each book only after its filing became public, does not rescue anything. It shaves the picture slightly worse, median minus 3.1 points a year.
So the copy-trade is dead. The data isn’t.
Here is the turn, and it is where this 13F post series is headed.
Everything above measures funds one at a time, which is how everyone instinctively uses 13F filings, and it fails.
But single funds may simply be the wrong unit of analysis.
You cannot identify tomorrow’s consistent winner, and there may be no such category to identify.
But consistent losers are real, common, and detectable, which means pruning is possible even where picking is not. And the academic literature, plus my own replication of it, says something one fund at a time cannot: a basket built from the overlapping high-conviction holdings of well-chosen filers, bought on the public lag, has historically carried a real, modest edge over the index.
Not alpha, not magic, and I will show the honest attribution later in the series, but a repeatable, rules-based something where the one-genius dream is a provable nothing.
So that is the road ahead: why the copy of even a good fund leaks (next post), what the research actually found in the lagged-basket idea, how to choose whom to listen to when only losing persists, what agreement between independent stock pickers means, what the edge turns out to be made of, and what a live quarter looks like through all of it.
The Q2 filings land in August; the series ends by reading them with you.
The genius was never in the leaderboard. Whether there is anything in the crowd is a better question, and it has a more interesting answer.
Frequently asked questions
Does copying the best-performing funds from 13F filings work? Historically, no. Funds finishing a 3-year era in the field’s top quarter beat the index only 44% of the time in the following era, with a median excess of -0.7pp a year, and only about 3% of funds beat the index across all four eras since 2013, roughly what luck alone would produce.
Do 13F filings show a fund’s whole portfolio? No. They show US-listed long positions only: no short positions, no foreign-listed holdings, no cash, and nothing traded in and out inside a quarter. A hedged fund’s 13F can look nothing like its actual risk.
How out of date is 13F data? Filings are due 45 days after quarter end, and most managers file at the deadline. A January purchase can surface in mid-May. Everything in this series treats that lag as a fixed cost of the data.
Not investment advice. Do your own research.